


The Ups and Downs of the Stock Market
How taking a yo-yo to the airport can help you better understand the stock market.

Most people have an intuitive idea of how the stock market works, due in part to daily reports along the lines of, “The Dow was up,” or “The Dow was down” by so many points, often with the terms soar or plunge thrown in for a more dramatic headline.
These reports lack context and lead to common misconceptions and costly overreactions.
(The Dow, by the way, is a 30-company index chosen by a committee and is price-weighted. It does not “ride the winners” like the market-cap-weighted S&P 500. We’ll cover this more in a future post.)
We’re going to use a trip to the airport—and a yo-yo—as analogy in order to explore what’s really going on.
If you understand this, you’ll likely make more money over the rest of your investing career (i.e., the rest of your life) and experience far less stress along the way.
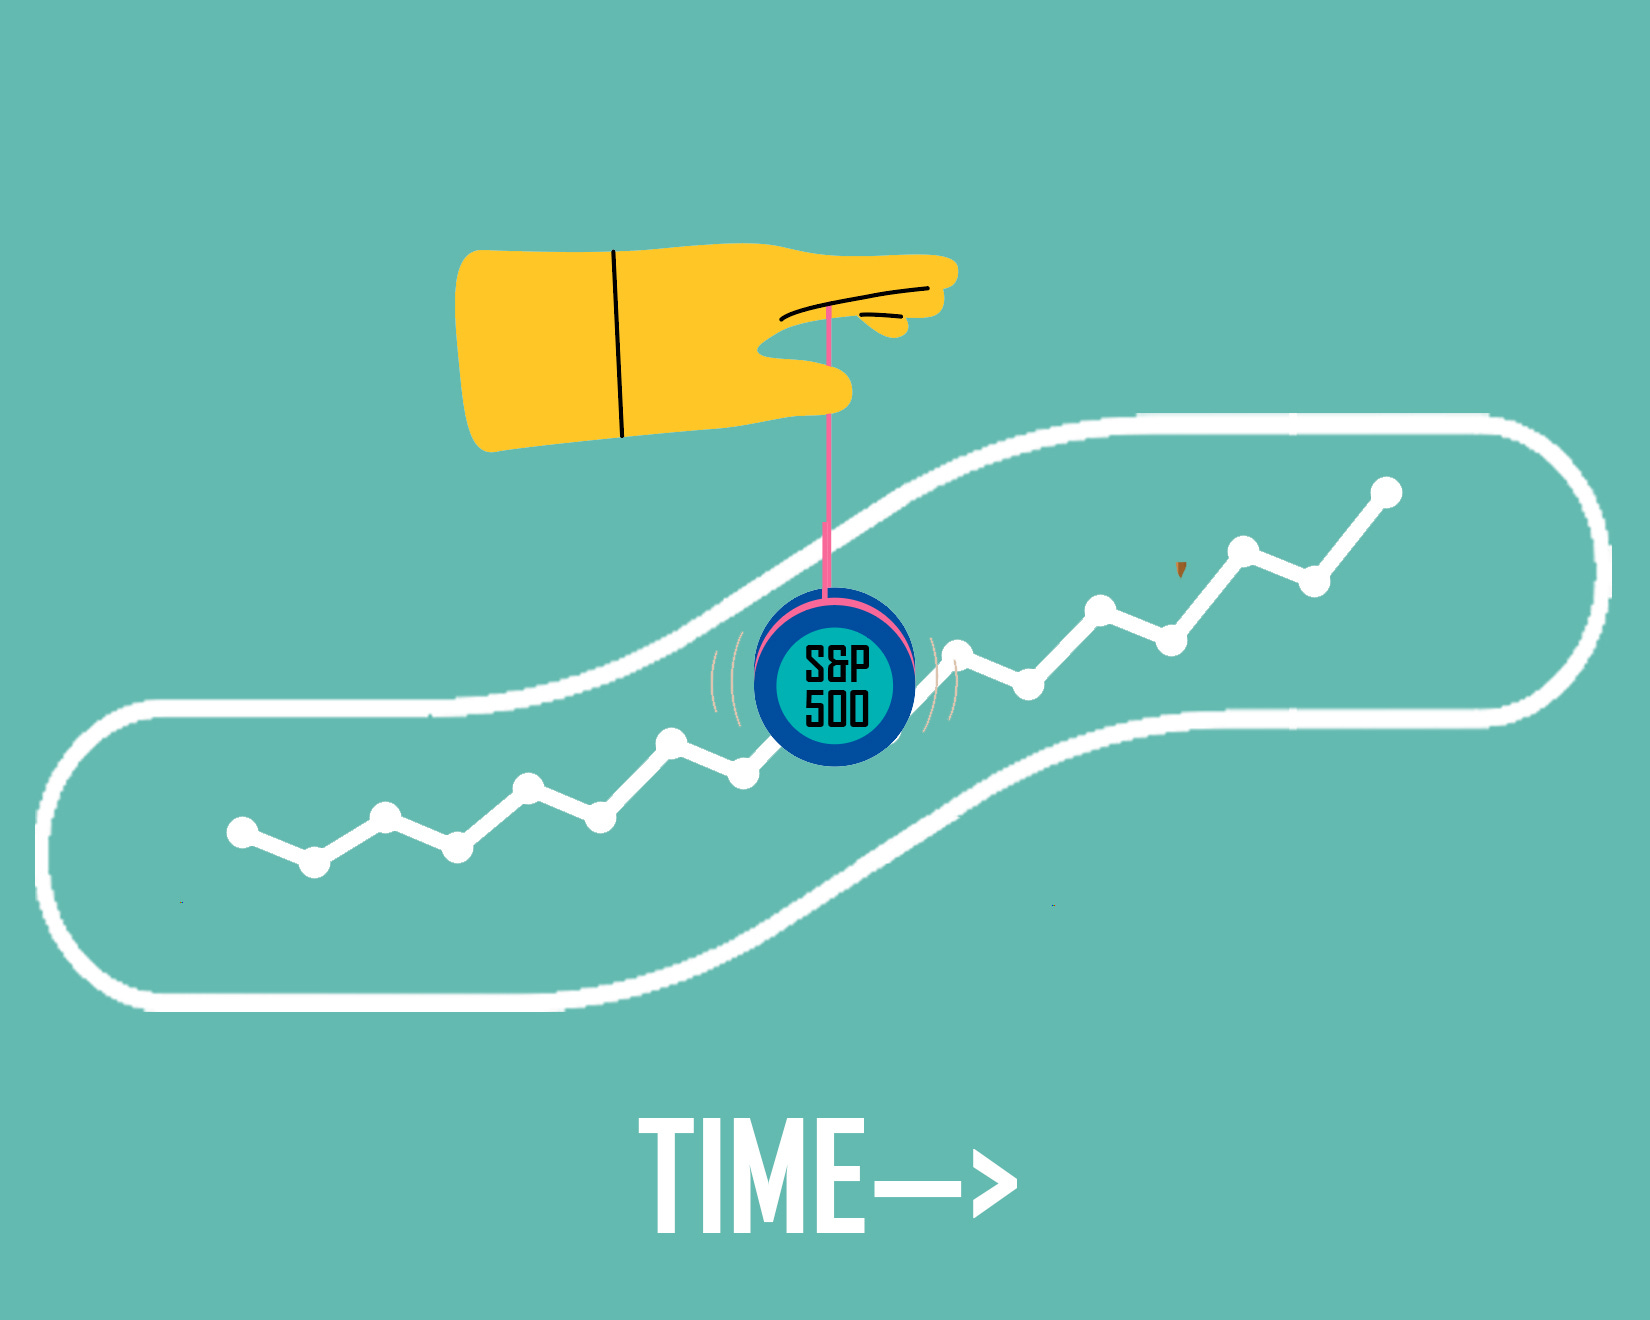
A Yo-yo On a Moving Sidewalk
Let’s assume the ups and downs of the stock market are represented by a yo-yo going up and down and that investing in the stock market is like playing with the yo-yo while walking on a moving sidewalk (like you see in the airport).

When you hear the financial news, this is what it sounds like. Up one day; down the next.
But that’s not what’s happening.
These reports typically just mention the number of points up or down, but they never take into account how a real portfolio grows with compounding.
A Yo-yo On an Escalator
Once we factor in compounding—and the fact that you win more than you lose—you realize that it’s not like playing with a yo-yo on a moving sidewalk, it’s like playing with a yo-yo while riding up an escalator.
Over time, successive lows are higher than previous highs.
Speaking of which, what percentage of the time would you guess the stock market sets a record high in any calendar year?
Frequently when the market sets a new record high—like it did earlier in 2024—there’s some concern that perhaps “getting in at the top” is not smart and you should wait until it goes down.
Of course, anything can happen, but that’s generally not a smart decision. Historically, the stock market has set a record high in any given calendar year 61% of the time!
This shouldn’t surprise you. If you win far more than you lose—playing with the yo-yo while going up an escalator—you inevitably are going to hit record highs.
It’s another reason being out of the market is so risky for the long-term investor. While you’re waiting to get back in, the market is leaving you behind.
Historical View (Logarithmic Scale)
Let’s look at this with a real chart.
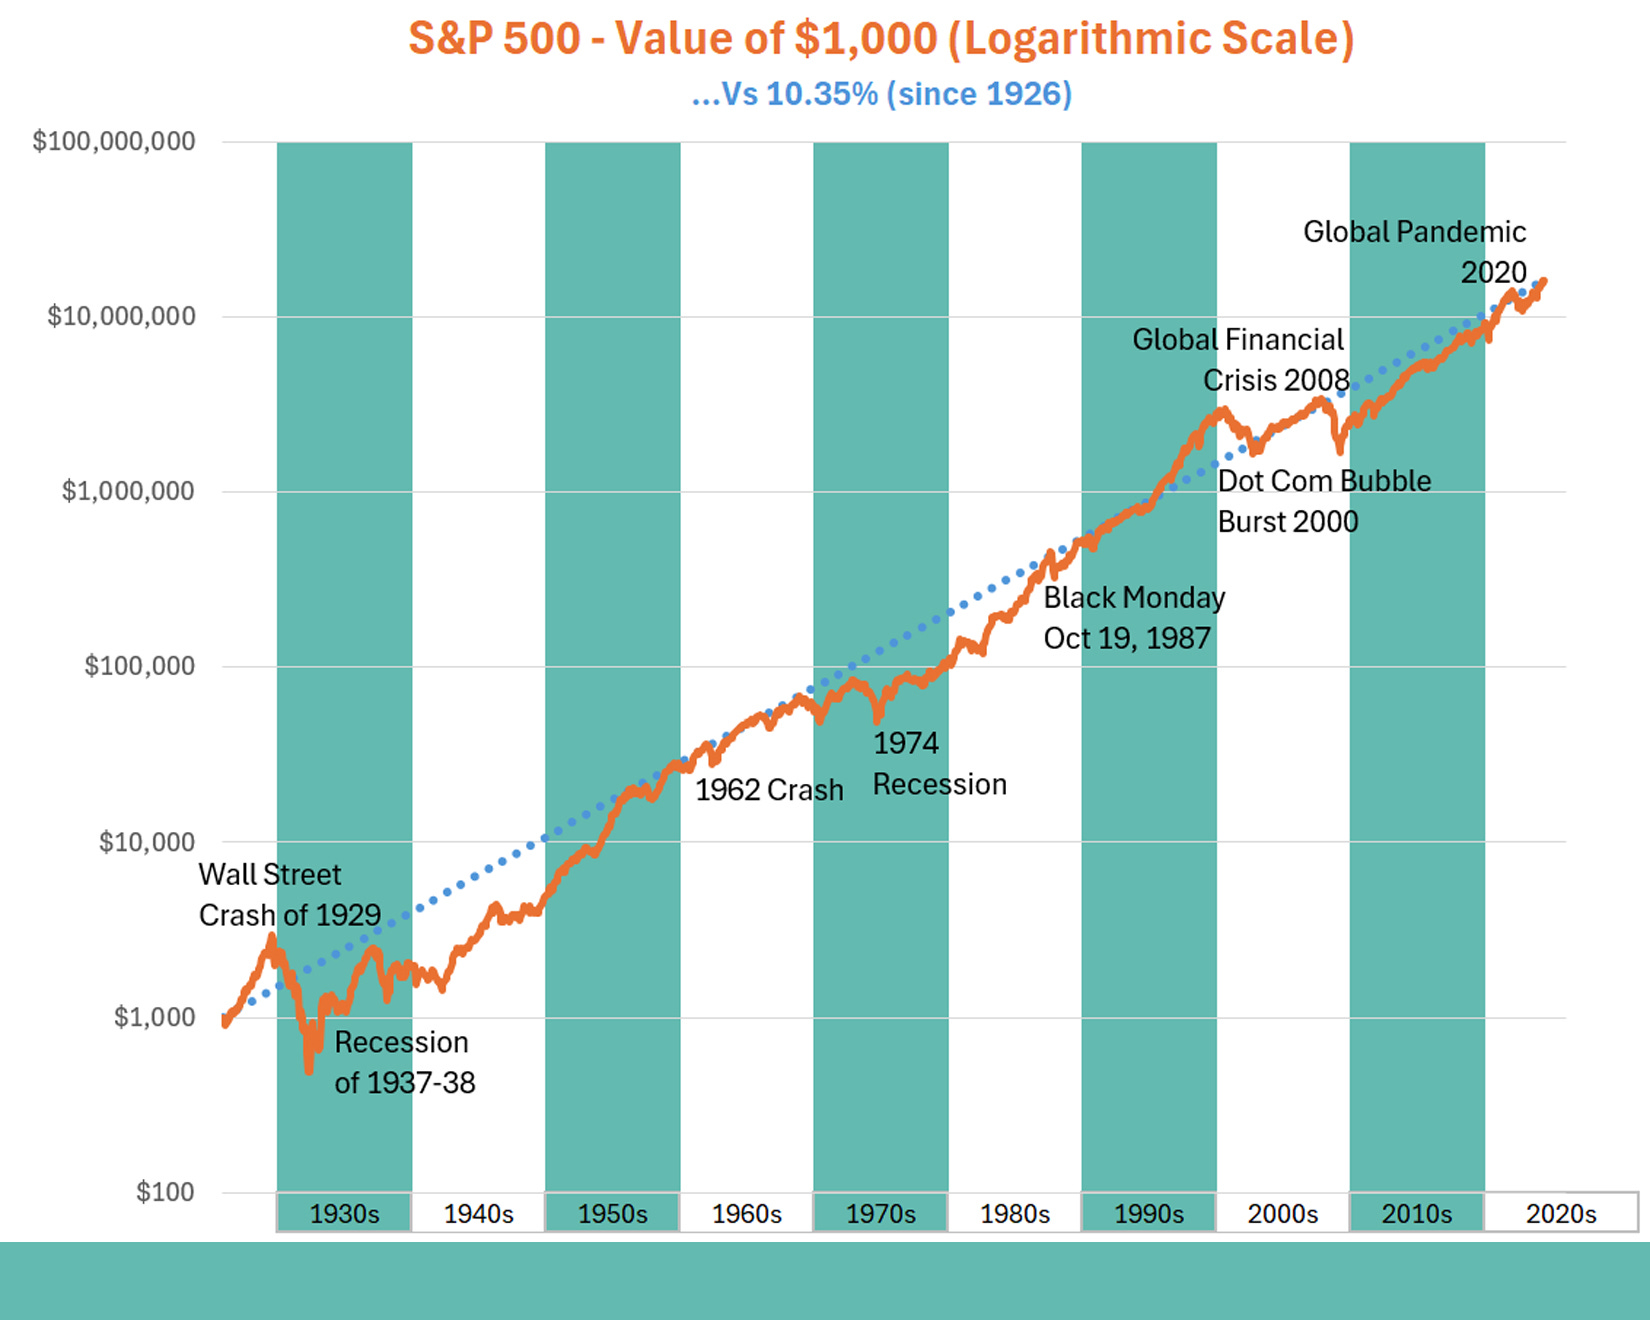
This shows the growth of $1,000 since 1926. To make it possible to see what’s going on, the scale is different than you’re used to seeing. Each horizontal line is 10 times greater than the previous value (i.e., it’s a logarithmic scale).
The dotted Blue Line shows growth at 10.35%, the long-term historical return on stocks.
Check out the periods of major declines and how successive lows were higher than the previous ones (riding up the escalator).
Historical View (Linear Scale)
And here’s another view of the same data except that this time we’re using a scale you’re used to. Each horizontal line goes up by an equal dollar amount (i.e., a linear scale).
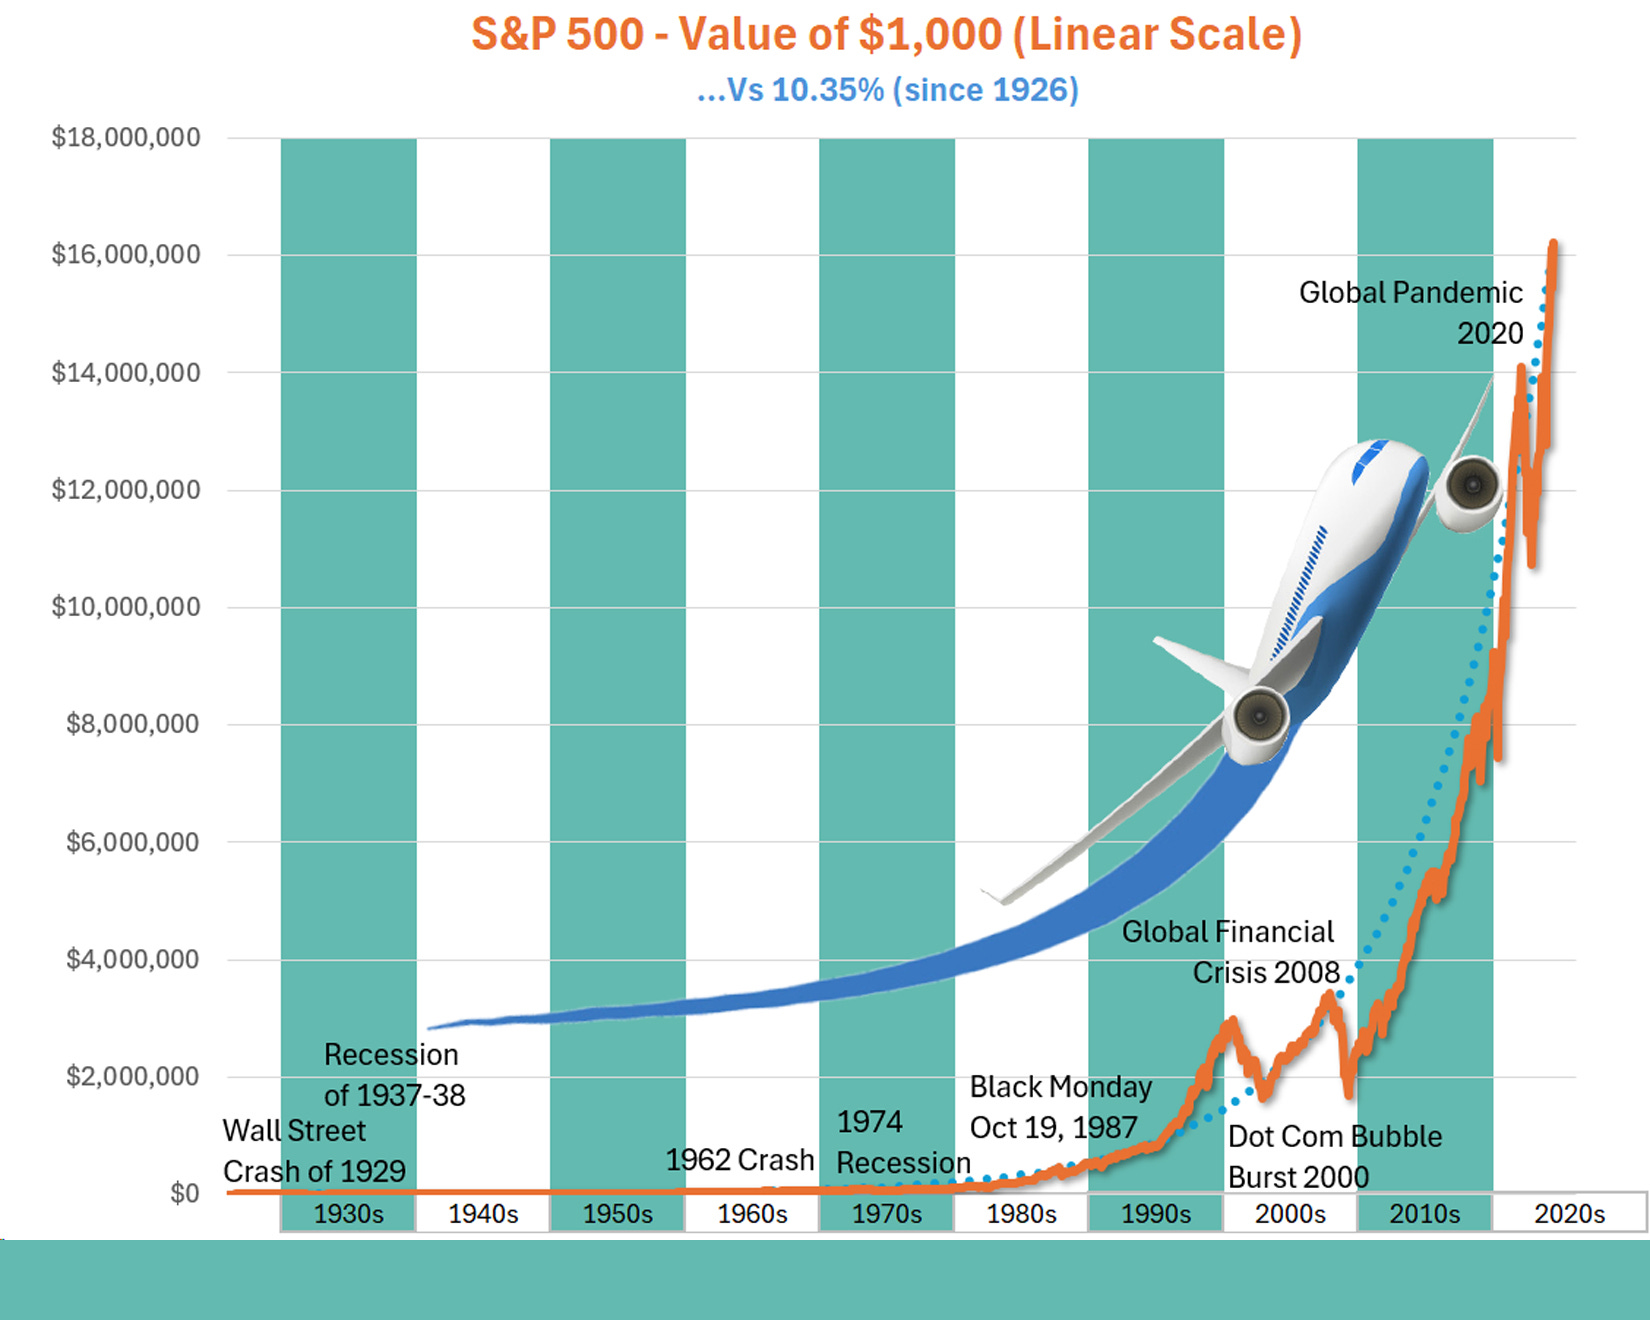
When looked at this way, the staggering impact of compounding completely overwhelms what happened in early years. The historical “crashes” are just little blips.
In terms of our analogy, investing in stocks isn’t playing with a yo-yo on a moving sidewalk. It’s not even playing with a yo-yo on an escalator. It’s playing with a yo-yo while on a plane that is taking off!
Think of that next time you’re at the airport!
Stuart & Sharon