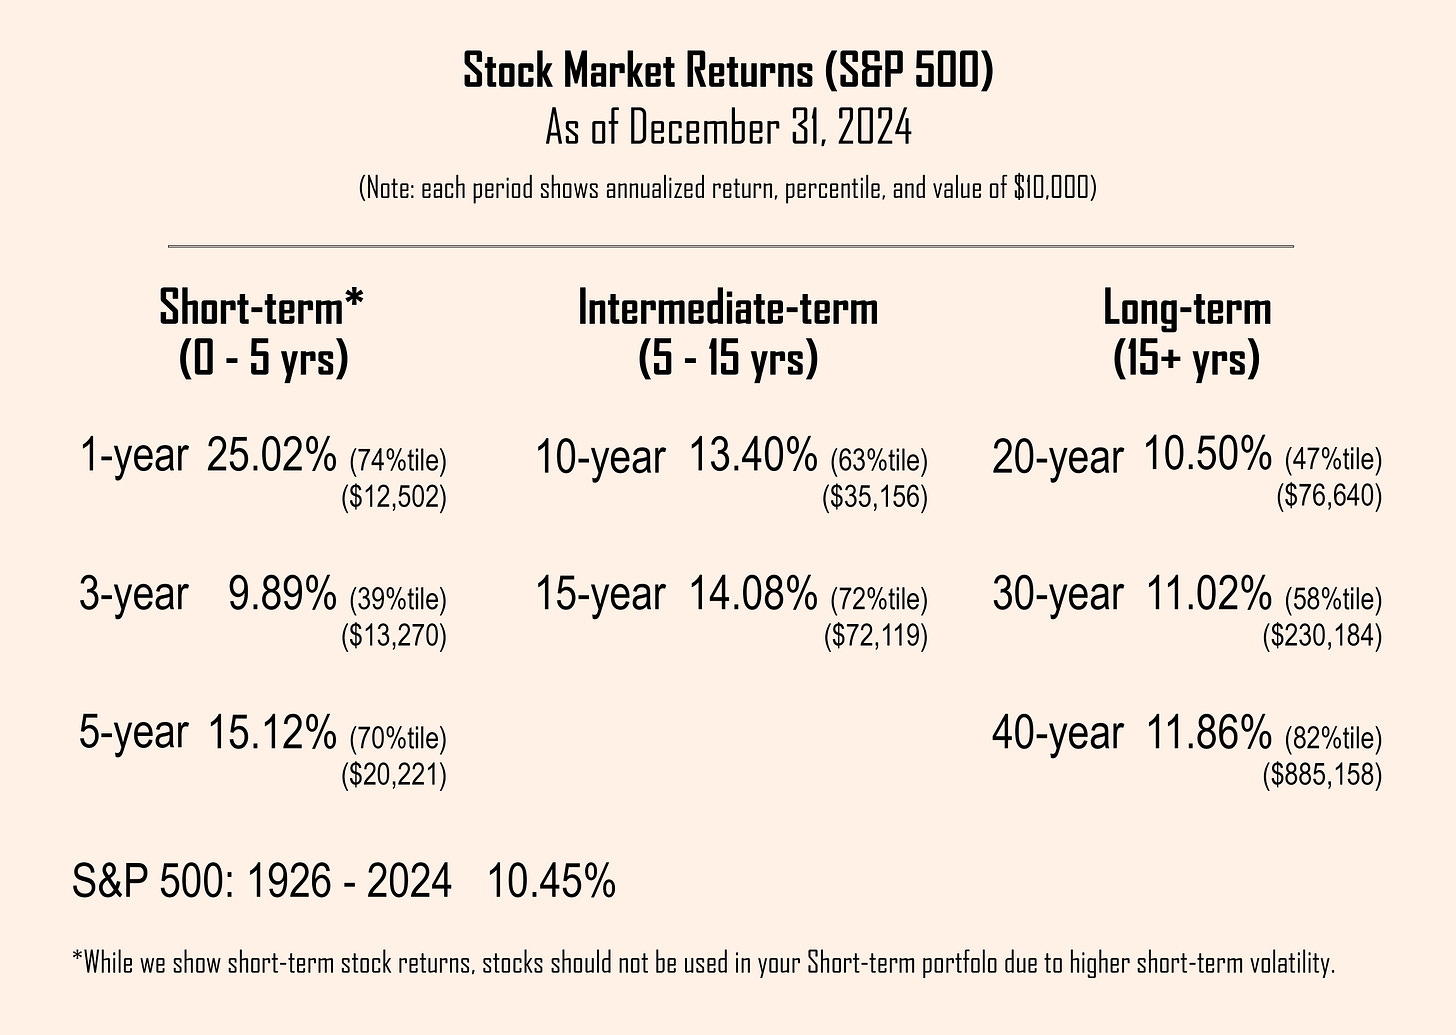
We’re going to look at stock market returns (as of December 2024) using the same format we used at the end of September.
We’ll look at annualized returns, percentile returns, and the value of a one-time investment of $10,000 over 1-year, 3-year, 5-year, 10-year, 15-year, 20-year, 30-year, and 40-year periods.
To get the percentiles, we rank all the returns from best to worst (since 1926) for each timeframe and see how far down the return falls on the list. If it’s in the exact middle, it would be the 50th percentile. If it’s three-quarters of the way down, it’s the 25th percentile. If it’s in the 90th percentile, it’s really humming along and getting close to the best 1-year return ever.
The value of $10,000 lets you know how much you’d have if you made a one-time investment and left it alone. This is where the power of compounding shows up.
Before you look at the numbers, we’d like you to think about what to expect.
Here are some questions to consider.
What do you guess the return was in 2024 and where would you guess it ranked from a percentile standpoint?
Which timeframe (1-, 5-, 10-, 15-, 20-, 30-, or 40-year) would you guess had the highest annualized return?
If we tell you the 40-year annualized return is 11.86%, what would you guess the value of the one-time investment of $10,000—made at the end of December 1984 would be at the end of December 2024?
Of the different timeframes, which do you think is least important for the long-term investor?
Alright, let’s take a look at the numbers and make a few comments.
Long-term Annualized Return
At the very bottom of the chart, notice that the long-term annualized return is 10.45%. We normally just round this to 10% when we talk about the long-term annualized return of stocks.
1-Year Return
The stock market return for 2024 was 25.02% (which followed a return of 29.61% in 2023).
The 1-year return was the highest of any of the timeframes we measured.
The 1-year return of 25% was in the 74th percentile meaning that about a quarter of the time we’ve seen higher 1-year returns and, as we’ve noted in previous posts, about a quarter of the time we’ve seen negative returns. The other 50% of the time we’ve seen 1-year returns ranging between 0% and 25%.
Of all the returns we’re showing you, the 1-year return was probably the only one you heard reported by the financial media. They almost exclusively focus on what’s happened recently.
Arguably—or obviously if you’re a regular reader of our posts—the 1-year return is the least important to the long-term investor. These short-term returns can be quite volatile but tend to even out over time.
3-Year Return
The 3-year return was 9.89% which is in the 39th percentile. Given what happened in 2023 and 2024, this may seem odd—i.e., too low. What we tend to forget is that the return for 2022 was -18.11%.
5-Year, 10-Year, and 15-Year Returns
The 5-year, 10-year, and 15-year returns were all above average with rankings of 70th percentile, 63rd percentile, and 72nd percentile, respectively.
20-Year Return
In our view, the 20-year return provides the best gauge of whether the stock market is overvalued, undervalued, or at more average levels. There is a high correlation between the 20-year return and how the stock market performs over the subsequent 15 years.
The 20-year return was 10.50%, which is in the 47th percentile. It’s about as average as you can get.
By contrast, the 20-year return as of December 1999—just before the dot com bubble burst—was 17.89% which was the 100th percentile, the highest ever 20-year return.
This all suggests that stock market returns over the next 15 years are more likely to be average, but could really be anywhere within the historical range of 20-year returns (roughly 2% to 18%).
30-Year and 40-Year Returns
Both the 30-year and 40-year returns have been above average. Note that the value of a one-time investment of $10,000 would have grown to $230,184 and $885,158, respectively. Pretty impressive!
If you have been investing for this long you should be very pleased with the growth of your portfolio (assuming your actual investments kept up with the market and your portfolio asset allocation wasn’t unduly conservative).
Summary
The goal of this post was to let you know that what you’re hearing about the stock market—primarily just reporting the short-term returns—doesn’t tell the whole story. In fact, it tells the wrong story.
You should always look at returns that match your investment timeframe.
Best regards,
Stuart & Sharon


